



















Javier Molina, Markets analyst at etoro, highlights the dichotomy between a rising market, Wall Street, and interest rates that are once again weighing on valuations. Inflation is forcing the market to price in a more hawkish Fed, putting the sustainability of stock market gains to the test. Nvidia faces a decisive test for artificial intelligence. Beyond its results, what matters is how much growth depends on the financing it provides to its own customers and what concentration risk this poses for portfolios.
Wall Street closed the week higher. The SP500 gained 2.5%, the Nasdaq 2.2% and the Dow Jones 2%. The gains coincided with a notable rise in US bond yields and pressure on Nvidia following the departure of Jensen Huang. Next week, the company’s results will help show how artificial intelligence growth expectations fit into a market that is once again contemplating higher rates.
US CPI rose 0.4% month-on-month in October, versus the 0.3% expected. Producer prices offered some relief, rising 0.3% month-on-month, one tenth less than forecast, although the core rate remained at 5% year-on-year. The two-year bond reached 4.86% by Friday, some 35 basis points above the previous week’s close. The market was practically pricing in a 25 bps hike in December and was beginning to assign some probability to a 50 bps move.
Against this backdrop, Nvidia is scheduled to report results on Tuesday the 17th. Estimates point to revenue of $108.81 billion and earnings per share of $2.47. The company has beaten forecasts in each of the last eight quarters, so another strong figure would immediately raise the question looking towards 2027… how much visibility does Nvidia have on orders, and how much does that forecast depend on its customers maintaining their pace of investment?
The departure of Jensen Huang raises a question about Nvidia’s role in the artificial intelligence business. In addition to selling chips, the company invests in some of its customers and backs with guarantees projects that use its equipment. We estimate the total of investments, commitments and guarantees identified in public documents at close to $190 billion. Part of that figure corresponds to future commitments and guarantees that would only be executed under certain conditions. For investors, the question is how much of chip demand would hold up if Nvidia reduced its financial support.
That being the case, the question for investors goes beyond how much Nvidia they hold in their portfolio. If they also hold shares in other tech companies and a fund tracking the SP500, part of those positions may depend on the same expectation: that companies keep increasing their investment in artificial intelligence. If that spending slows and rates stay high, how much of their portfolio could be affected at the same time? The answer matters especially for those who expect to need part of that money in the coming months and could be forced to sell in the middle of a downturn.
Key technical levels
THESE ARE NOT INVESTMENT RECOMMENDATIONS. Only comments from an informative technical point of view.
1.- S&P
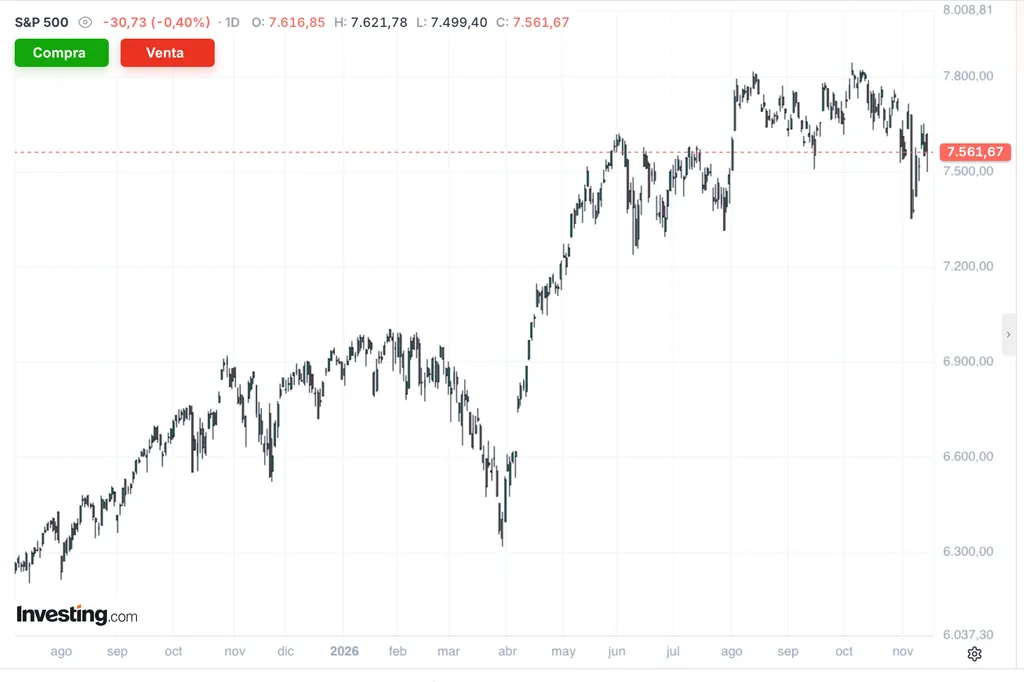
The SP500 closed at 7,562 points after touching 7,499 during the session. The rebound from the 7,350 area has halted the November decline, but the index remains below its October highs, near 7,800.
In the short term, rebounds are topping out progressively lower. The 7,500 level is the first reference for the week. If the index holds above it and recovers the 7,650–7,700 zone, it would once again have room to test 7,800. If it loses 7,500 on a closing basis, the recent low of 7,350 would be the next level to watch. Below that, the reference would be around 7,200.
That being the case, the key reading for the week is whether the index manages to break above the high of the latest rebound. As long as it stays below 7,650–7,700, short-term pressure will remain.
Source: investing.com
2.- BITCOIN (BTC)
Bitcoin faces a spike in volatility amid capital outflows
The options market anticipates larger swings while ETF redemptions persist. Bitcoin’s ability to absorb fresh selling around $62,000 will be decisive in assessing this week’s downside risk.
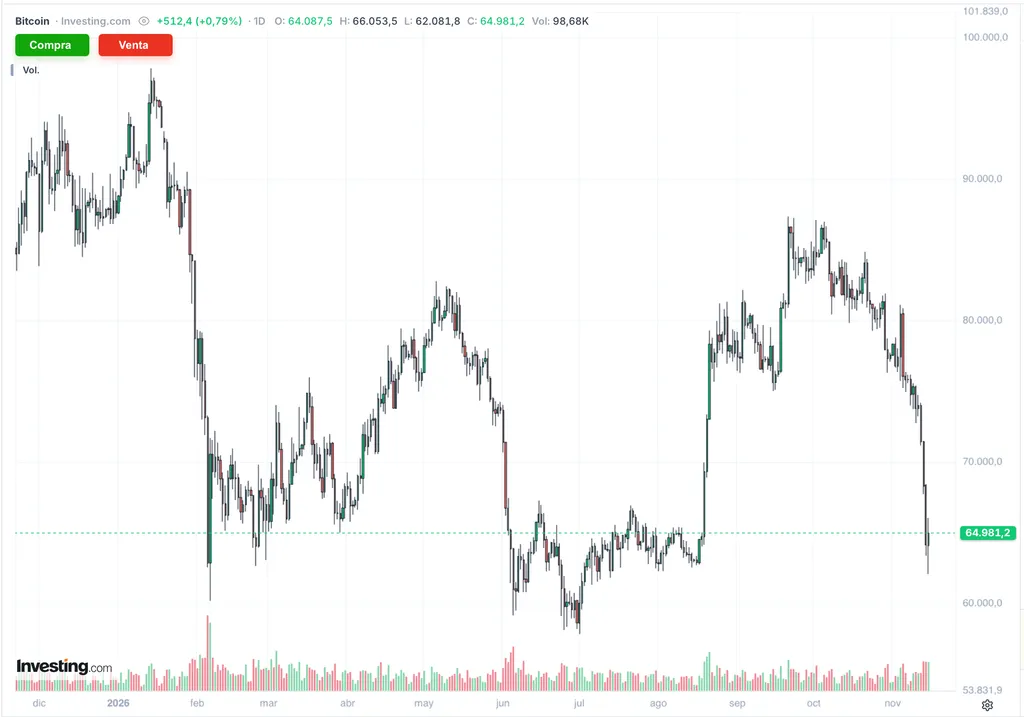
The most significant change in bitcoin lies in how the market is starting to price risk. 30-day implied volatility has gone from 39% to 47% annualised in just one week. In daily terms, this means going from an implied move of 2.1% to almost 2.5%. The drop to $62,000 reflects how quickly the price can move when selling triggers forced position closures.
In the seven days prior to 13 November, $1.56 billion in bitcoin futures positions were liquidated, of which almost 90% were long positions. Open interest fell by around 9%, to $47.3 billion, although part of that decline reflects the lower dollar value of contracts that remain open. Liquidations, meanwhile, make it possible to measure the volume of exposure the market has been forced to close.
Institutional flows add to this pressure. US spot bitcoin ETFs recorded net outflows of $1.065 billion, with redemptions in all five sessions of the week. Over the past two weeks, cumulative outflows have reached approximately $2.35 billion. Ethereum ETFs lost another $400 million during the past week. To assess the strength of any recovery, I think it is more relevant to check whether these outflows begin to ease than to interpret the move of a single session.
As for on-chain data, I would particularly watch realised losses. On Friday they reached $1.53 billion, double the figure from a week earlier. If bitcoin retests $62,000, manages to hold that level and realised losses begin to decline, we would have a first sign that selling pressure from those closing positions at a loss is starting to subside.
In this scenario, and also bearing in mind macroeconomic references and Nvidia’s upcoming results, I would watch two levels.
Below $62,000, a breakdown without subsequent recovery would open the door to seeking support in the $59,800–57,700 zone. If fresh ETF outflows coincide with another spike in implied volatility, the risk of the price quickly cutting through that range would increase.
On the other hand, reclaiming $68,000 would be a first constructive signal, although it would gain consistency if redemptions ease over several sessions and ethereum starts to regain ground against bitcoin.
That being the case, the question is not only whether bitcoin manages to rebound from current levels, but whether the market is managing to absorb selling without the need for further leverage adjustments. As long as implied volatility keeps rising and ETF flows remain negative, any recovery will be exposed to sharp moves. The stabilisation of both indicators would make it possible to start talking about a more solid improvement in the outlook.
Crypto assets are highly volatile instruments and can experience significant moves over very short periods. The scenarios and levels above are analytical references, not predictions or personalised investment recommendations. Past performance does not guarantee future results
Source: investing.com
Get the best of the week in your inbox
Every Monday: the most-read stories on Territorio Blockchain, the new podcast episode and news about our events. Free, no spam.
We will send you an email to confirm. You can unsubscribe at any time with the link in every newsletter. Privacy