























Javier Molina, Markets Analyst at eToro.- The week has left an uncomfortable feeling, the kind that cannot be properly explained by a headline but weighs on you when you look at your portfolio with some perspective. The indices ended almost flat, but the road there has been revealing, as we have seen intraday all-time highs, abrupt sell-offs, precious metals in euphoria mode… and then, chaos.
The SP500 managed to cross the psychological 7,000-point level for the first time, although it did not last long. That milestone, which in another context would have been celebrated, became a turning point. Not because the level was “expensive” in itself, but because it coincided with a subtle but relevant shift, as the Federal Reserve made it clear that the rate-cutting cycle is not automatic, and the market, which had internalised a narrative of almost infinite liquidity, began to readjust its expectations.
The result was selective punishment. Big Tech posted reasonably solid results, but not enough to justify prior positioning. Even good news triggered sell-offs. That is always a symptom to watch, because when the market stops rewarding the positive, the risk no longer lies in the data but in the accumulated excess.
That same pattern was amplified in precious metals. Gold and silver had gone, in a matter of months, from being defensive assets to becoming the epicentre of global momentum. Vertical rallies, soaring implied volatility and an evident disconnect from what they are supposedly meant to price in: inflation and real rates. The message makes it clear that people were not buying stability, they were buying a narrative.
The subsequent collapse was proportional to the excess. No powerful macro catalyst or dollar shock was needed. It was enough for the flow to reverse. Leverage, systematic strategies, automatic stops and retail panic did the rest. What happened does not invalidate gold’s long-term role, but it does leave an obvious risk management lesson: when a “safe-haven” asset behaves like a speculative asset, it stops fulfilling its function in a portfolio.
At the same time, the macro front adds more noise than clarity. The market keeps looking at US employment as if it were a reliable anchor, when every annual revision shows that what we think we know today can change radically tomorrow. The figures arrive late, are revised downwards and, even so, are used to justify immediate investment decisions. It is not a new problem, but it is increasingly relevant in an environment where politics and institutions show evident cracks.
Added to this is the fiscal and funding issue, as the Treasury continues to walk a tightrope, trying not to strain the bond market while implicitly acknowledging that, further down the line, it will have to issue more debt at a higher cost. It is not the ideal scenario for assuming that fixed income will automatically return to being the perfect cushion of past decades.
It all fits into a broader idea: the death of dogmas. For years, the average investor grew used to thinking that certain relationships were almost natural laws (stocks versus bonds, growth versus inflation, risk versus safe haven). The last decade, and especially the years following the pandemic, have shown that many of those relationships depended on a very specific historical context that no longer exists.
This does not mean that “anything goes” or that the portfolio must be reinvented every quarter. It means something more basic and, at the same time, more demanding: accepting that risk is no longer managed with fixed recipes, but with balance, real diversification and humility in the face of volatility.
The underlying message is neither bearish nor alarmist. It is prudent.
Trends may continue, markets may rise and narratives may last longer than seems reasonable. But when asset behaviour starts to look more like a bubble than a value-preservation mechanism, the investor’s job is not to guess the top, but to make sure a sharp reversal does not compromise the portfolio’s survival.
In this decade, more than ever, managing risk does not mean giving up opportunities. It is the necessary condition for continuing to seize them.
What to watch this week
A key and compressed week, where what matters will not be the data, but the market’s reaction.
PMI and ISM (Monday–Wednesday)
Watch prices paid and services. Resilient activity with persistent inflation complicates the rate-cut scenario and pressures valuations.
Employment (Friday)
The January report sets the tone. More than the figure, watch bonds and the dollar: strong employment that pushes long-term yields higher reinforces the risk of a Fed that stays more restrictive for longer.
Megacap earnings
Alphabet, Amazon and AMD report. The risk is not in “beating”, but in the guidance: good figures followed by declines would signal prior excess.
Key technical levels
THESE ARE NOT INVESTMENT RECOMMENDATIONS. Only comments from an informative technical point of view.
1.- S&P
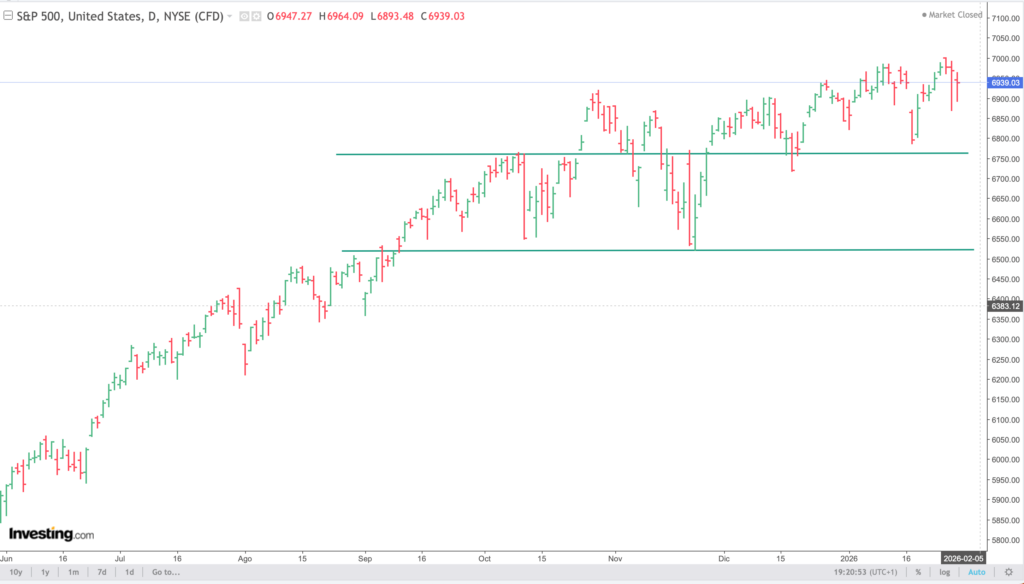
From a technical standpoint, the SP500 is not reversing, it is slowing down for now. After a very prolonged rally, the market has entered a phase of consolidation near the highs, more digestion than correction.
The key reference is 6,700–6,750. That level has been repeatedly defended and as long as it holds, the underlying trend remains bullish. There is no reversal structure, only controlled pauses.
On the upside, the 7,000 points act as a psychological ceiling. The market gets there, hesitates and pulls back. It is not a strong rejection, it is a lack of new catalysts. Good news is no longer enough here, as the bar is high.
Volatility is key and, although it remains contained and there are no clear lower highs, it must stay that way to think this fits more with a healthy pause than with aggressive distribution. If that does not happen, watch out, trouble is coming.
Source: investing.com
2.- BITCOIN (BTC)
The recent correction in bitcoin (and also in ethereum) should be understood as a multifactor adjustment episode, where institutional outflows, liquidity contraction, technical deleveraging and a more uncertain macro environment converge. It is not a failure of the long-term thesis, but a demanding phase of redistribution.
1. The immediate trigger: institutional flows in reversal
For the first time since the launch of spot ETFs, there have been three consecutive months of net selling (November, December and January). In the last week alone, nearly 15,000 BTC were sold, weakening support at the high levels where institutional buying was concentrated (≈98,000 USD).
These outflows have acted as a direct channel for risk reduction, something especially relevant in a market that had internalised institutional presence as an anchor of stability.
2. Forced deleveraging: the amplifier of the move
The withdrawal of flows met a market poorly positioned in derivatives. In the most recent session, approximately 1.8 billion USD were liquidated, with more than 90% corresponding to long positions.
Bitcoin accounted for some 790 million USD and ethereum close to 425 million. This phenomenon explains the speed of the move: it was not panic, it was a lack of liquidity against leveraged positions.
3. Additional supply: distribution by large holders
At the same time, long-term holders have reduced their net balance by around 144,000 BTC over the last month, taking advantage of earlier levels to rotate exposure.
This flow coincides with the conflict between:
- New whales (ETFs and public companies), with high cost bases and lower tolerance for volatility.
- Historical whales, with much lower cost bases and ample capacity to distribute without stress.
4. Base liquidity in contraction
The situation is aggravated by the tightening of global liquidity as measured in stablecoins. The growth of USDT and USDC has slowed notably, with significant burn episodes and occasional strains on the peg.
Historically, as in 2022, when stablecoin liquidity contracts, bitcoin enters prolonged corrective phases.
5. Macro risk: politics and correlation with tech
Added to this context is a non-negligible macro factor:
- Temporary US government shutdown. The shutdown itself is not the biggest risk, but the subsequent uncertainty tends to penalise risk assets. Impact on liquidity.
- Bitcoin maintains a high correlation with Big Tech, behaving like one more of them, but leveraged.
If the NASDAQ and companies such as Microsoft, Apple, Meta or Tesla fail to set new highs, bitcoin’s recovery capacity is limited.
6. Levels and cyclical scenario
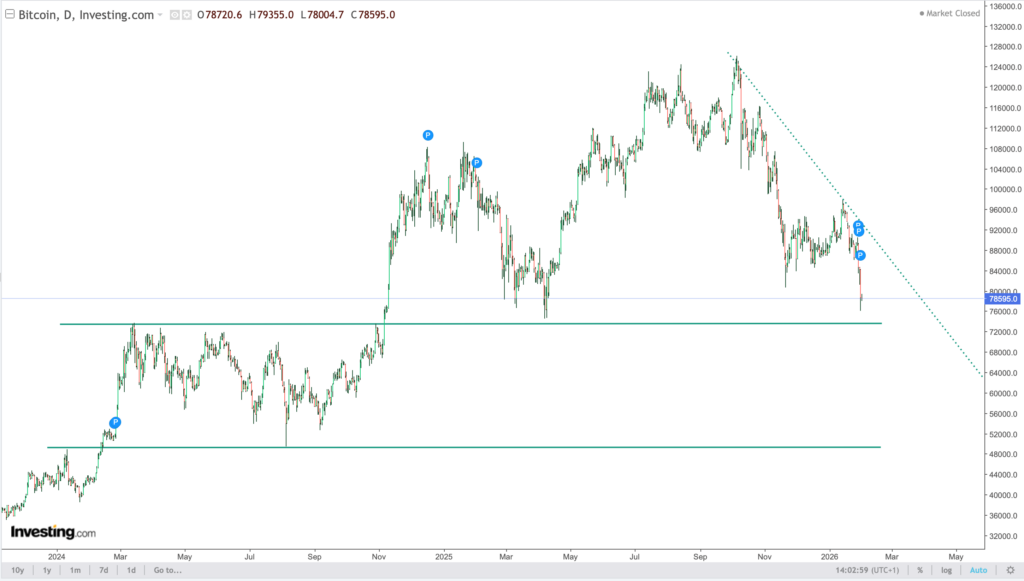
The market appears to be going through a bearish phase of the cycle, active for about 118 days.
Under this framework:
- Immediate key upper level: 85,000 USD. Losing it after options expiries increases the risk of a continued downtrend.
- Current intermediate support: 75,000 USD, a likely test zone if the pressure persists.
- Adjustment resolution zone: broad, between 50,000 and 60,000 USD, consistent with a 50–60% correction and close to the realised price (~55,600 USD).
7. Final reading
We are not facing a systemic panic event, but rather a phase of flushing out excesses, where liquidity once again becomes the dominant factor. Institutional adoption does not eliminate cycles; it makes them more technical and more sensitive to the macro environment.
Source: investing.com